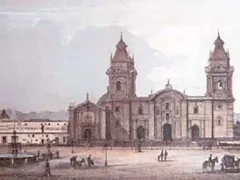
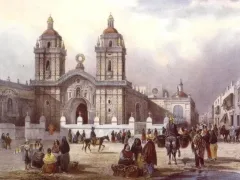
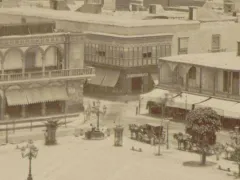
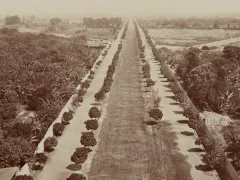
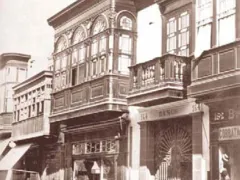
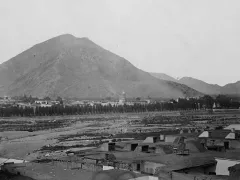
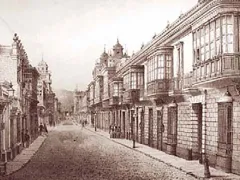
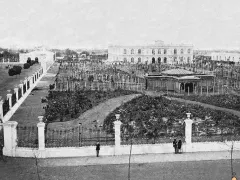
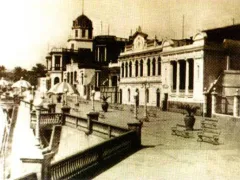
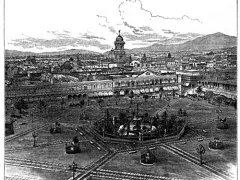
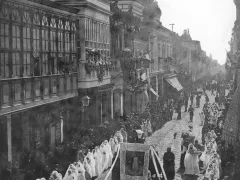
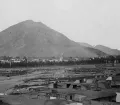
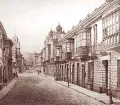
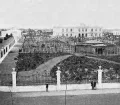
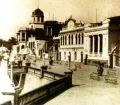
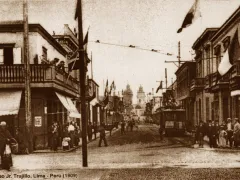
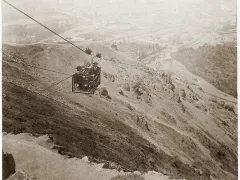
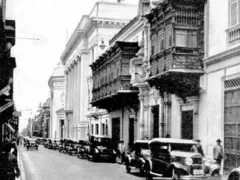
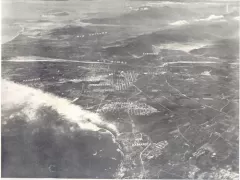
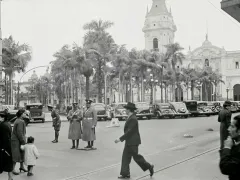
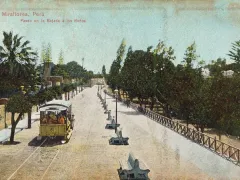
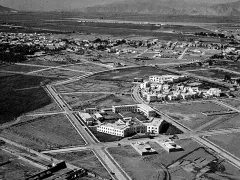
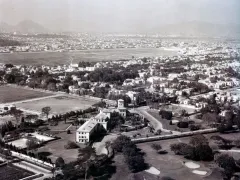
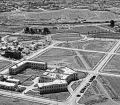
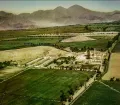
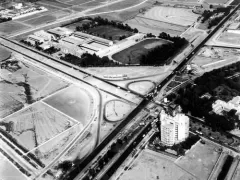
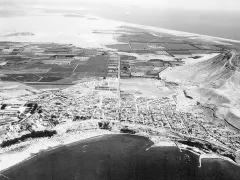
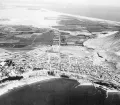
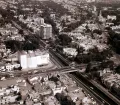
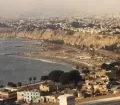
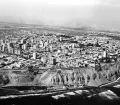
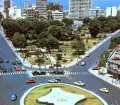
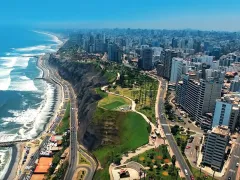
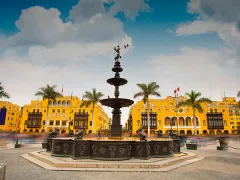
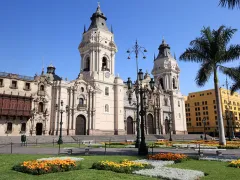
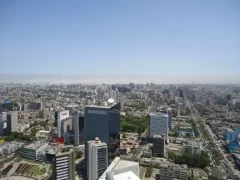
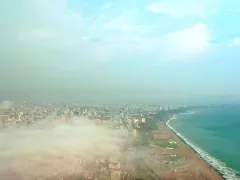
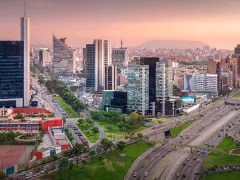
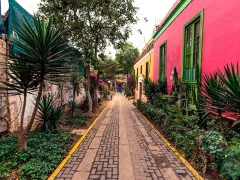
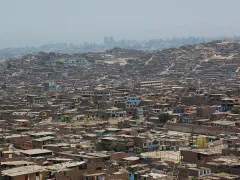
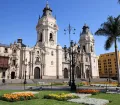
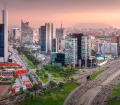
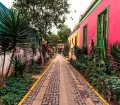
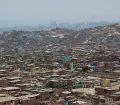
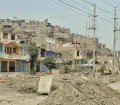
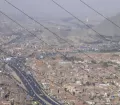
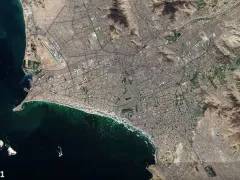
Lima, the Peruvian capital, today is not only the 32nd largest city in the world but as well among the 30 most populous metropolitan areas. How could the once beautiful City of Kings and most important city in the Americas during colonial times and later the lovely capital of independent Peru with nice haciendas, fishing villages and lots of green surrounding it develop into an uncontrolled grown, sprawling, chaotic and loud megacity?
Content overview
- Historical view on Lima’s population development
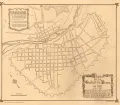
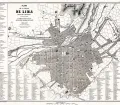
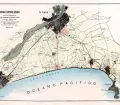
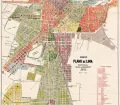
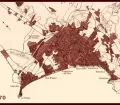
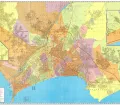
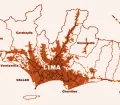
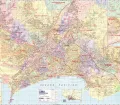
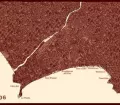
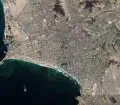
- Lima: from rough settlement to megacity in maps
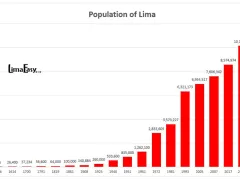
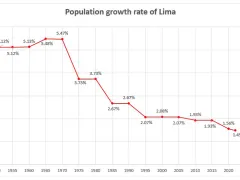
- Population development in Lima, Callao and the Lima Metropolitan Area in graphs
- Population of Lima by district
- Population of Callao by district
Historical view on Lima’s population development
There are many reasons why Lima developed into an uncontrolled grown, sprawling, chaotic and loud megacity. The foundation for this was laid already in colonial times.
Foundation of Lima and population development in colonial times
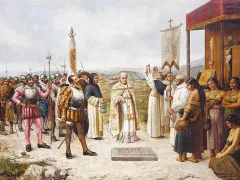
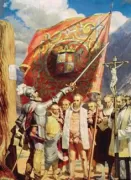
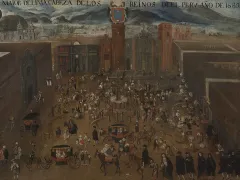
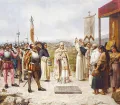
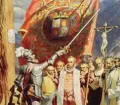
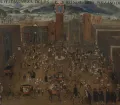
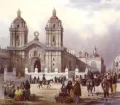
On January 18, 1535, the Spanish conqueror Francisco Pizarro founded Lima on the territories and temples of the native leader Taulichusco next to the Rimac River. At the beginning, Lima only accommodated a dozen conquerors. However, Pizarro had big plans for “his” city.
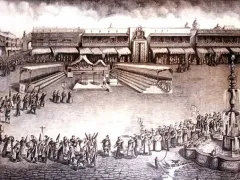
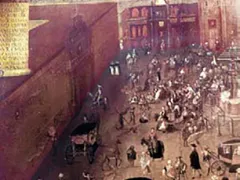
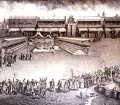
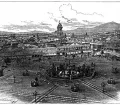
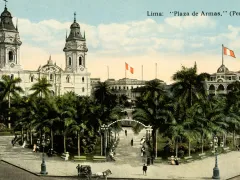
He based the design and layout of the future City of Kings on the model of cities in Spain (especially Seville). The first 'mansions', at this time simple houses with reed roofs, were all built cuadra (block) by cuadra surrounding a main square, the Plaza Mayor or Plaza de Armas. The complete city was only made up of a little over 100 city blocks.
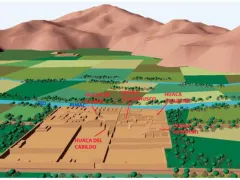
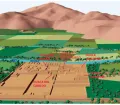
Lots of green, fields and plantations, adobe pyramids built by pre-Hispanic civilizations and small settlements surrounded the newly founded city. The port of Callao, established two years after Lima’s foundation to serve as Lima’s gateway to the world, was still “far away”, even though it is located just about 10km to the west.
Over the next 80 years, Lima became the capital of the Viceroyalty of Peru, the site of a Real Audiencia (high court) and the headquarters of the Spanish Inquisition in South America. The national mint (the Casa de la Moneda), the archdiocese, the first university on the American continent (the University of San Marcos) and the first newspaper were established.
At the beginning of the 17th century, Lima was the political, economic, cultural, and religious center of all Spanish colonies in South America and already had over 26,000 inhabitants.
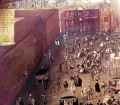
During the next 200 years, the city itself continued to grow steadily, but in an orderly manner. Slowly but surely neighboring areas were "colonized" or developed as well. Fertile lands surrounding the colonial city were given to the Spanish aristocracy, which built their haciendas on them and cultivated the land. Slaves, natives, and immigrants were brought to the capital to either serve the conquerors or work on the haciendas.
Small settlements along the coast, like Miraflores, Chorrillos or Barranco, were populated and grew into fancy beach resort and spas. And of course, the port of Callao became the most important port of the Spanish Crown in South America.
While Lima had a population of 250 inhabitants in 1536, one year after its foundation, by 1614 the city accommodated already 26,400 inhabitants; by 1791 had grown to 56,600 inhabitants and in 1820, a year before Peru's independence, the city had 64,000 citizens.
Population development in Lima in the 19th century
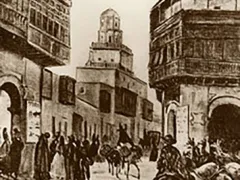
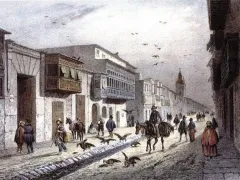
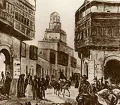
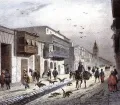
During the 19th century, the capital of independent Peru, experienced a significant population growth. Even though Lima suffered greatly during the fight for independence in the 1820s and in the early years of the Republic because of the breakdown of the social and economic system, by the mid-19th century a boom based on guano exports (guano are droppings of seabirds which are an effective fertilizer and gunpowder ingredient) made Lima an interesting and lucrative destination for migrants and immigrants. In 1850, a railroad line between Lima and Callao was completed. Others along the beach to the growing villages of Miraflores and Chorrillos followed.
Lima’s growing industries, the (for the time) excellent infrastructure and the city’s “modernity” attracted many Peruvians from rural areas seeking economic opportunities and a better life. Lima as well became a popular destination for immigrants from Europe and Asia doing the same while contributing to the economic and cultural growth of the city.
In 1861, Lima's population for the first time reached the 100,000-inhabitant mark. To make way for the unavoidable expansion of Lima, the city walls were torn down in 1872. The War of the Pacific (1879-1884) put a damper on Lima’s development. However, starting in the 1890s, the city went through a process of urban renewal and expansions.
Within only a hundred eventful years, Lima more than tripled its number of inhabitants and struggled to cope with the rapid influx of people and with related challenges, such as emerging social inequality and inadequate infrastructure.
Population development in Lima in the 20th century
Instead of getting a break, Lima experienced continuous substantial population growth and significant demographic changes throughout the 20th century, which brought the city to its knee.
Lima not only went through a process of urban renewal at the beginning of the century, but also saw a more rapid expansion. At the end of the 19th and beginning of 20th century, the second industrial revolution reached the Peruvian capital, and many factories and industrial plants sprang up around the city.
Migrants from the underdeveloped Peruvian Andean regions flocked into the capital, hoping to better their living conditions and getting a piece of the cake. Growth took place mostly towards the south of today's Historical City Center, where, for example, the district of La Victoria emerged as a fast-growing worker's neighborhood. By 1925, Lima's population had grown to 260,000 inhabitants, which by 1940 more than doubled to over 533,600. With the city expanding towards the Pacific Ocean, large green areas, some haciendas, and small farms were soon divided into plots and sold as building sites.
After World War II, the increasing industrial and commercial activity and the poor living conditions in the Peruvian provinces led to an even greater migration movement from the the Andean regions to Lima. Additionally, many foreign immigrants found their way to the Peruvian coast, trying their luck and hoping for a better future.
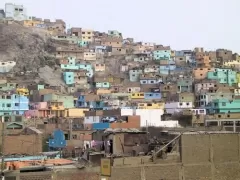
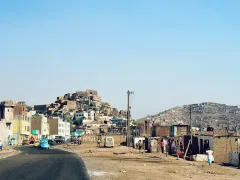
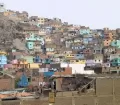
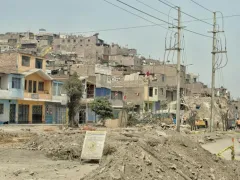
By 1951, Lima's population had reached 835,000. In the middle of the 20th century, the old colonial City of Kings and once magnificent capital of independent Peru reached its first point of no return on the way to a complete change for the worst. Because of extreme poverty and natural disasters, even more rural Peruvians migrated to Lima. Throughout the city, huge "pueblos jóvenes" (shanty towns) without proper infrastructure developed quickly. Only ten years later, Lima was home to 1,262,100 people. Soon the former distant cities of Miraflores, Barranco, Chorrillos, Magdalena and the port of Callao were absorbed by the growing metropolis, which as well expanded to the east. The last haciendas and farms were either squatted by migrant families or broken up by an agrarian reform. In the following years, hundreds of thousands of poor Peruvians came to Lima, hoping to escape their disastrous living conditions in the provinces. By 1972, Lima had over 2.8 million inhabitants, by 1981, already nearly 3.6 million. The city struggled to cope and already then was at a breaking point. But the worst was yet to come.
In the 80s, Peru faced serious economic and social problems. Because of economic mismanagement by the military regime, natural disasters and the fall of international commodity prices, the production decreased, wages depressed, unemployment exaggerated, and inflation increased dramatically. The economic collapse worsened living conditions for all, but mainly for poor Peruvians in the provinces and in Lima. This provided a breeding ground for social and political discontent.
The emergence of the terrorist group Sendero Luminoso (Shining Path) in rural areas was shortly afterwards followed by the Tupac Amaru Revolutionary Movement (MRTA) that was established in Lima. This sent the country and Lima further into chaos. Even though the Peruvian capital was a favored place for assassinations, bombings, and overall violence, most terrorist activities took place in the rural areas. So, trying to escape the terror and the extreme poverty, many Peruvians left their homes in the provinces seeking a better future in Lima, however, ending in the ever-growing shanty towns and slums surrounding the city.
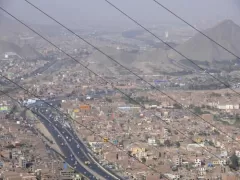
While at the beginning of the 1990s, the horrendous decade of terror ended, the Peruvian capital was on its knee and near complete collapse. Now, being home to well over 6 million people, Lima faced countless serious problems, including lack of proper housing for its citizens, lack of basic infrastructure, lack of basic public services, lack of proper mass transportation, massive traffic, enormous air pollution, increasing crime, and so on.
Population development in Lima in the 21st century
Lima continues to grow; however, at a much slower pace. Nevertheless, today Lima is home to over 10 million people, the Lima Metropolitan Area even to over 11 million people.
However, the city is struggling with the immense population growth in the last century. But thanks to better economic times and a slowly rising awareness for the citizens and the historic and cultural value of the city, over the past twenty years some parts of the city were cleaned up, made nicer or developed and the overall infrastructure, as well in poor areas, was improved or is on the way of improvement. Lots was done already, even more still has to be done.
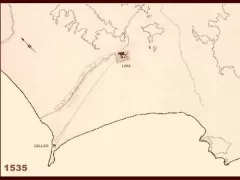
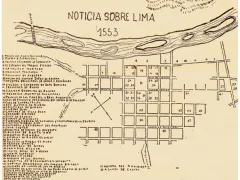
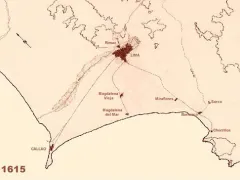
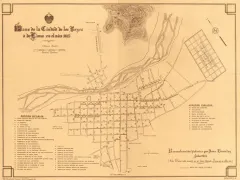
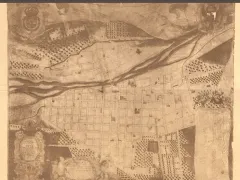
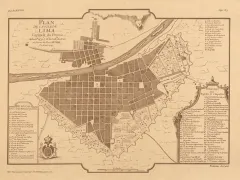
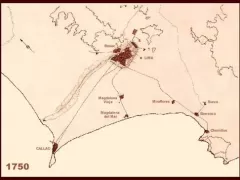
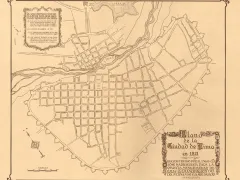
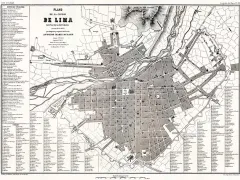
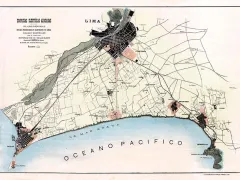
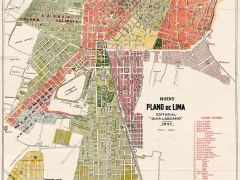
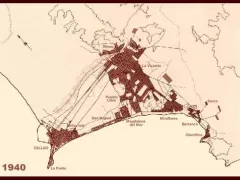
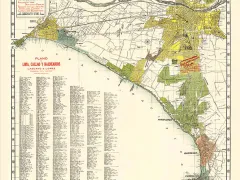
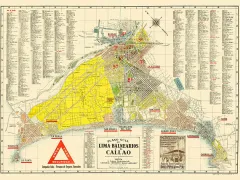
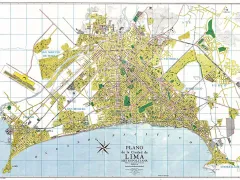
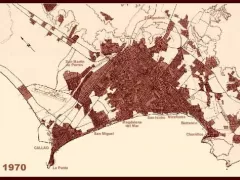
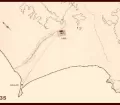
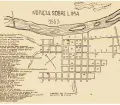
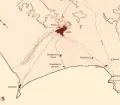
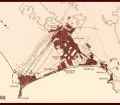
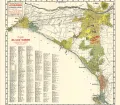
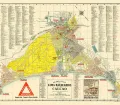
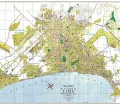
Lima: from rough settlement to megacity in maps
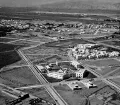
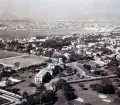
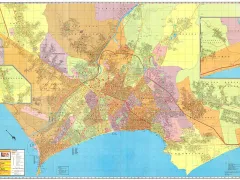
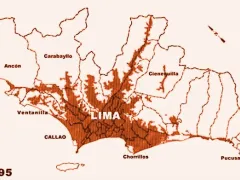
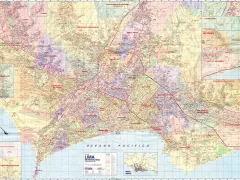
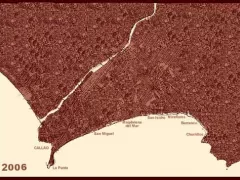
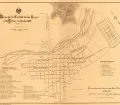
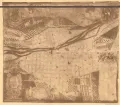
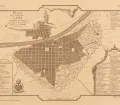
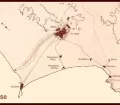
Historical maps showing the expansion of Lima
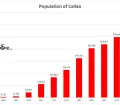
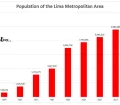
Population development of Lima and Callao in graphs
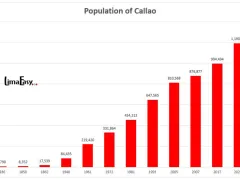
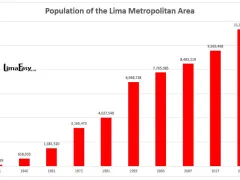
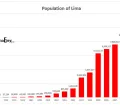
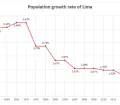
Find below graphs showing the number of inhabitants of Lima, Callao and the Lima Metropolitan Area
Population of Lima by district
The table below shows the inhabitans of each of Lima's 43 districts in 2005, 2007, 2017 and 2023; data source: Censuses, (*) for 2023 INEI projections
| District | Area (sqkm) | Population 2023 | Popublation 2017 | Population 2007 | Population 2005 |
|---|---|---|---|---|---|
| Total | 2672.28 | 10,148,810 | 8,574,974 | 7,606,342 | 6,954,517 |
| Ancon | 299.22 | 91,170 | 62,928 | 33,367 | 29,419 |
| Ate-Vitarte | 77.72 | 713,103 | 599,196 | 478,278 | 419,663 |
| Barranco | 3.33 | 37,525 | 34,378 | 33,903 | 35,280 |
| Breña | 3.22 | 97,906 | 85,309 | 81,909 | 78,864 |
| Carabayllo | 346.88 | 426,985 | 333,045 | 213,386 | 188,764 |
| Chaclacayo | 39.5 | 46,225 | 42,912 | 41,110 | 39,686 |
| Chorrillos | 38.94 | 373,332 | 314,241 | 286,977 | 262,595 |
| Cieneguilla | 240.33 | 40,683 | 34,684 | 26,725 | 15,784 |
| Comas | 48.75 | 598,263 | 520,450 | 486,977 | 464,745 |
| El Agustino | 12.54 | 233,757 | 198,862 | 180,262 | 165,425 |
| Independencia | 14.56 | 232,726 | 211,360 | 207,647 | 197,308 |
| Jesus Maria | 4.57 | 86,899 | 75,359 | 66,171 | 58,588 |
| La Molina | 65.75 | 168,839 | 140,679 | 132,498 | 124,468 |
| La Victoria | 8.74 | 195,620 | 173,630 | 192,724 | 190,218 |
| Lima city center | 21.98 | 276,482 | 268,352 | 299,493 | 289,855 |
| Lince | 3.03 | 63,854 | 54,711 | 55,242 | 52,123 |
| Los Olivos | 18.25 | 366,751 | 325,884 | 318,140 | 286,549 |
| Lurigancho-Chosica | 236.47 | 303,966 | 240,814 | 169,359 | 90,594 |
| Lurin | 181.12 | 115,330 | 89,195 | 62,940 | 55,953 |
| Magdalena del Mar | 3.61 | 69,488 | 60,290 | 50,764 | 48,445 |
| Miraflores | 9.62 | 116,526 | 99,337 | 85,065 | 77,543 |
| Pachacamac | 160.23 | 153,189 | 110,071 | 68,441 | 54,763 |
| Pucusana | 37.83 | 17,885 | 14,891 | 10,633 | 9,231 |
| Pueblo Libre | 4.38 | 99,591 | 83,323 | 74,164 | 71,892 |
| Puente Piedra | 71.18 | 416,531 | 329,675 | 233,602 | 203,473 |
| Punta Hermosa | 119.5 | 23,080 | 15,874 | 5,762 | 4,676 |
| Punta Negra | 130.5 | 8,914 | 7,074 | 5,284 | 4,473 |
| Rimac | 11.87 | 187,462 | 174,785 | 176,169 | 175,793 |
| San Bartolo | 45.01 | 9,424 | 7,482 | 6,412 | 5,733 |
| San Borja | 9.96 | 133,328 | 113,247 | 105,076 | 102,762 |
| San Isidro | 11.1 | 71,039 | 60,735 | 58,056 | 55,309 |
| San Juan de Lurigancho | 131.25 | 1,240,489 | 1,038,495 | 898,443 | 812,656 |
| San Juan de Miraflores | 23.98 | 430,772 | 355,219 | 362,643 | 335,237 |
| San Luis | 3.49 | 58,001 | 52,082 | 54,634 | 46,258 |
| San Martin de Porres | 36.91 | 782,075 | 654,083 | 579,561 | 525,155 |
| San Miguel | 10.72 | 183,597 | 155,384 | 129,107 | 124,904 |
| Santa Anita | 10.69 | 232,739 | 196,214 | 184,614 | 160,777 |
| Santa Maria del Mar | 9.81 | 1,251 | 999 | 761 | 88 |
| Santa Rosa | 21.5 | 41,619 | 27,863 | 10,903 | 9,379 |
| Santiago de Surco | 34.75 | 426,758 | 329,152 | 289,597 | 272,690 |
| Surquillo | 3.46 | 104,832 | 91,023 | 89,283 | 84,202 |
| Villa El Salvador | 35.46 | 441,794 | 393,254 | 381,790 | 367,436 |
| Villa Maria del Triunfo | 70.57 | 459,010 | 398,433 | 378,470 | 355,761 |
Population of Callao by district
The table below shows the inhabitans of each of Callao's 7 districts in 2005, 2007, 2017 and 2023; data source: Censuses, (*) for 2023 INEI projections
| District | Area (sqkm) | Population 2023 | Population 2017 | Population 2007 | Population 2005 |
|---|---|---|---|---|---|
| Total | 131.82 | 1,190,504 | 994,494 | 876,877 | 810,568 |
| Bellavista | 4.56 | 83,085 | 74,851 | 75,163 | 72,761 |
| Callao city center | 45.65 | 537,377 | 451,260 | 415,888 | 389,579 |
| Carmen de la Legua | 2.12 | 48,259 | 42,240 | 41,863 | 40,439 |
| La Perla | 2.75 | 65,849 | 61,417 | 61,698 | 59,602 |
| La Punta | 0.75 | 4,003 | 3,829 | 4,370 | 4,661 |
| Mi Peru | 2.47 | 54,905 | 45,297 | ||
| Ventanilla | 73.52 | 397,026 | 315,600 | 277,895 | 243,526 |


